This is a synthetic data set intended for testing and demonstration.
Function generate_faux_cell() simulates the faux cell data (note: in
the future, it is planned to parameterize thefuncion) and object faux_cell
is an instance of this dataset generated first time it is used.
The data set resembles the
chondro
data set but is entirely synthetic.
generate_faux_cell()

faux_cell
Format
The object faux_cell is a hyperSpec object that contains 875
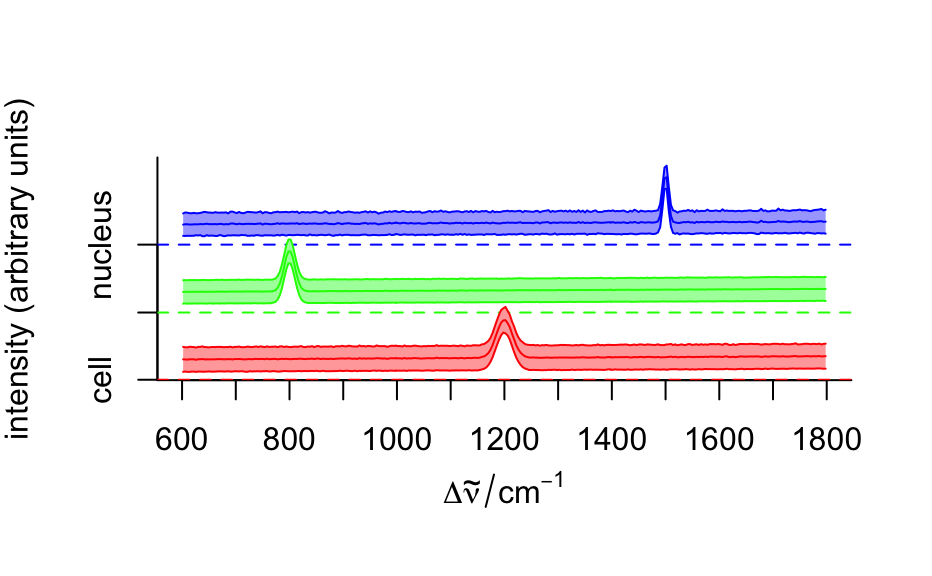
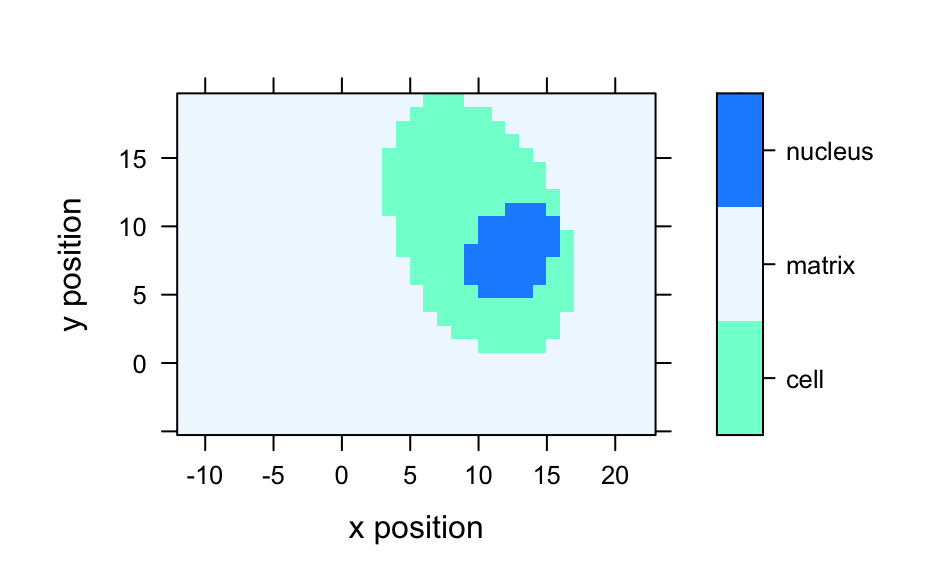
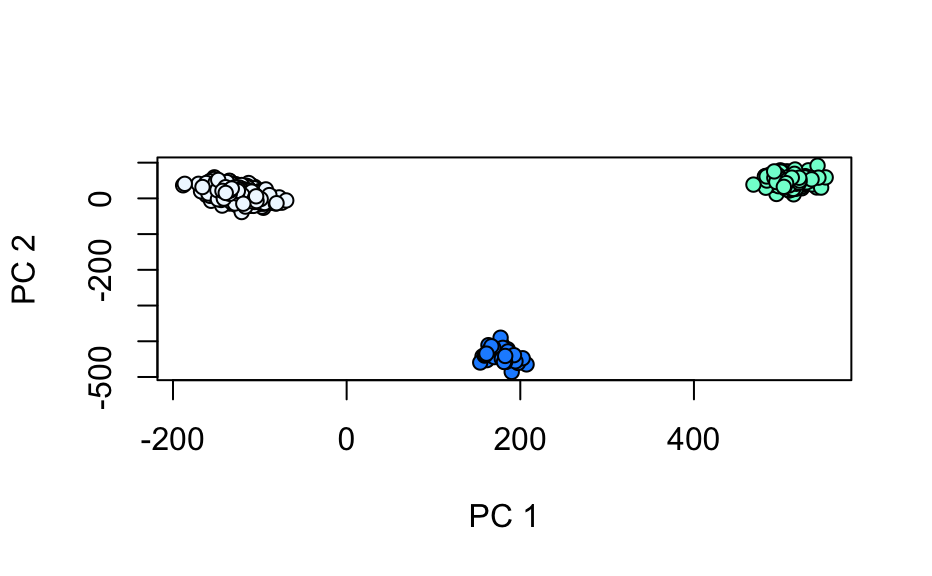
Raman-like spectra, allocated to three groups/regions in column region:
the matrix/background, the cell and the cell nucleus. Each spectrum is
composed of 300 data points. The spectrum of each region is unique and
simple, with a single peak at a particular frequency and line width.
Poisson noise has been added. The data is indexed along the x and y
dimensions, simulating data collected on a grid.
An object of class hyperSpec of dimension 875 x 4 x 300.
Author
Claudia Beleites, Bryan A. Hanson
Examples
#> hyperSpec object #> 875 spectra #> 4 data columns #> 300 data points / spectrum #> wavelength: Delta * tilde(nu)/cm^-1 [numeric] 602 606 ... 1798 #> data: (875 rows x 4 columns) #> 1. x: x position [numeric] -11.55 -10.55 ... 22.45 #> 2. y: y position [numeric] -4.77 -4.77 ... 19.23 #> 3. region: [factor] matrix matrix ... matrix #> 4. spc: intensity (arbitrary units) [matrix, array300] 54 75 ... 108# Plot mean spectra fc_groups <- aggregate(faux_cell, faux_cell$region, mean_pm_sd) plotspc(fc_groups, stacked = ".aggregate", col = c("red", "green", "blue"), fill = ".aggregate" )mapcols <- c(cell = "aquamarine", matrix = "aliceblue", nucleus = "dodgerblue") plotmap(faux_cell, region ~ x * y, col.regions = mapcols)loadings <- decomposition(faux_cell, t(pca$rotation), scores = FALSE) plot(loadings[1:5], stacked = TRUE)plot(pca$x[, 2], pca$x[, 3], xlab = "PC 1", ylab = "PC 2", bg = mapcols[faux_cell$region], col = "black", pch = 21 )


