These functions generate hyper-spectral datasets that are mainly used for exploring and testing functionality of hyperSpec.
generate_hy_spectra()generates several spectra.generate_hy_profile()generates depth, concentration, time-series profiles at a single wavelength.generate_hy_map()generates hyper-spectral map.
generate_hy_spectra(n_wl = 50, n = 20)

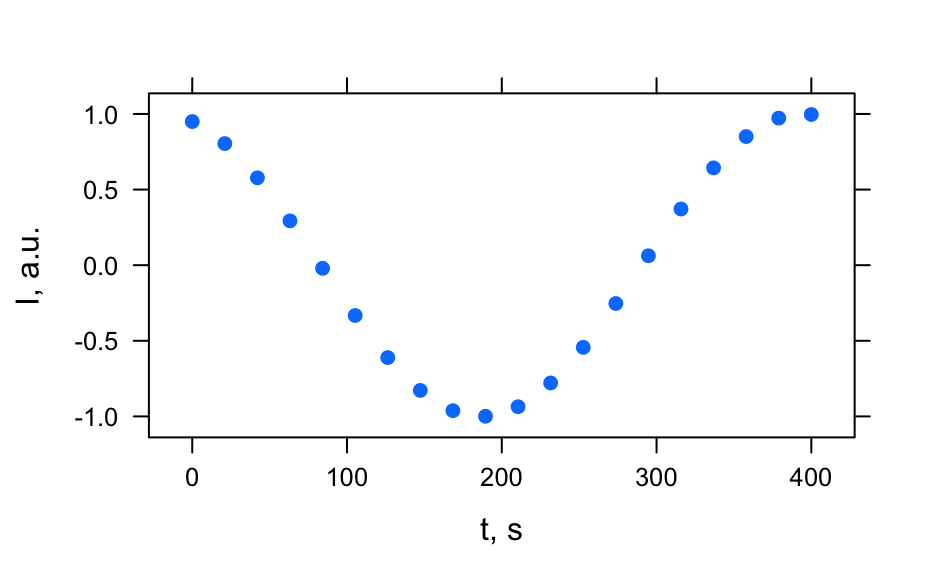
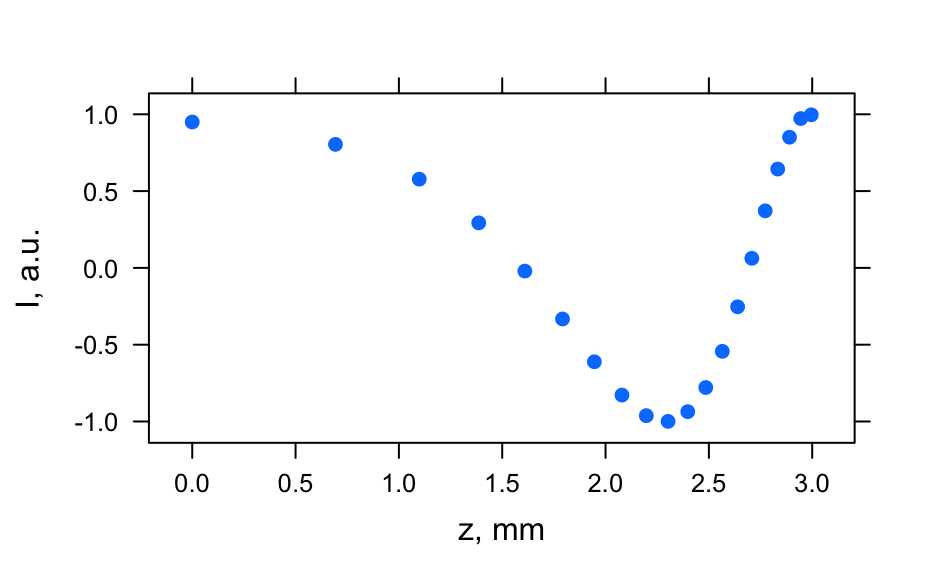
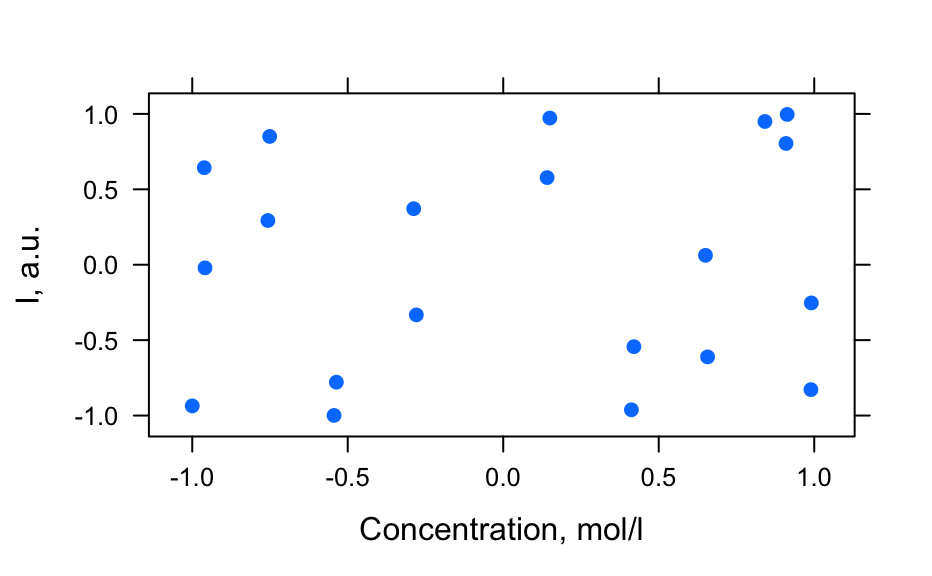
generate_hy_profile(n = 20, wavelength = 550)

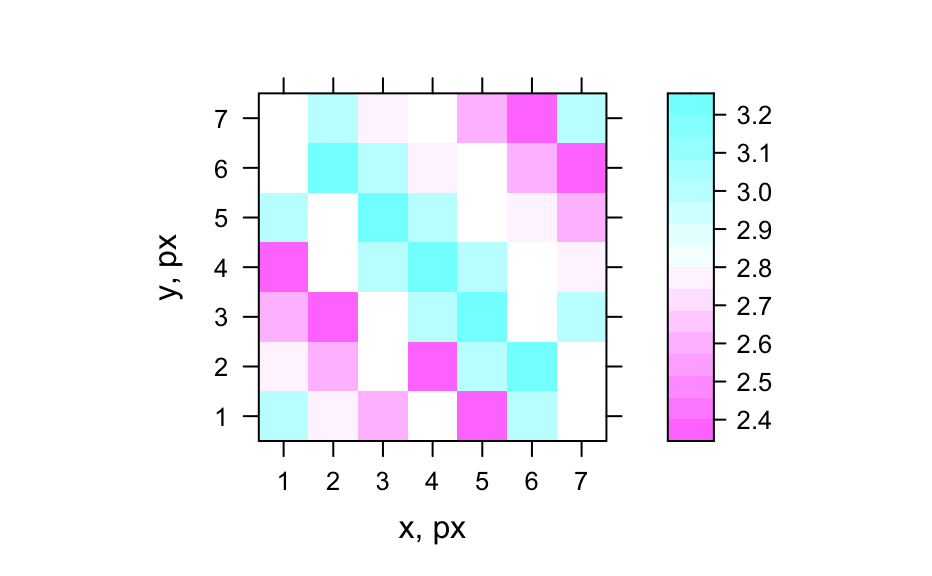
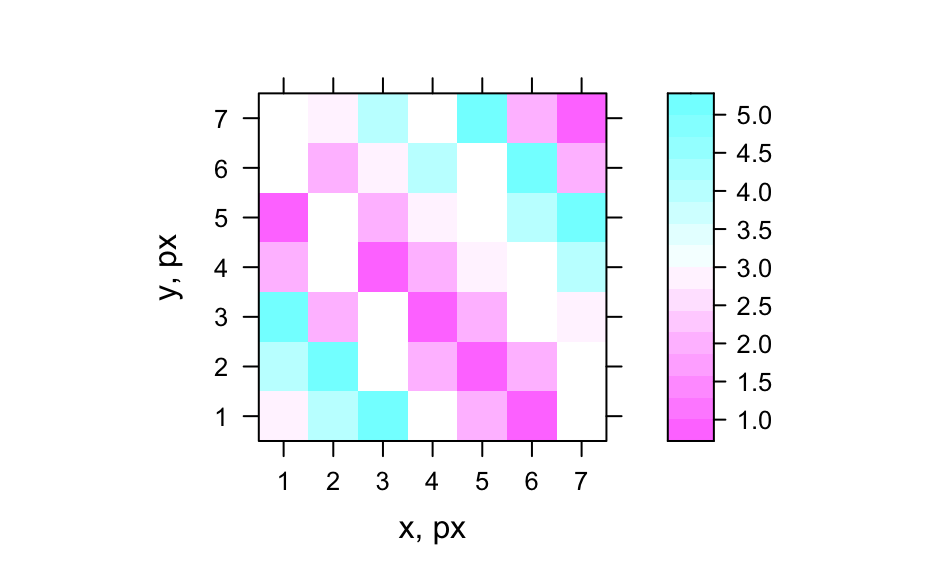
generate_hy_map(n_wl = 5, n_xy = 7, k = 5)
Arguments
| n_wl | (integer) Number of wavelengths (points per spectrum). |
|---|---|
| n | (integer) Number of spectra. |
| wavelength | (numeric) A single numeric value for |
| n_xy | (integer)number of pixels in x and y directions of hyper-spectral map. |
| k | integer not larger than |
Value
A hyperSpec object.
See also
generate_faux_cell()
Author
V. Gegzna
Examples
# Generate spectra hy_spectra <- generate_hy_spectra() hy_spectra#> hyperSpec object #> 20 spectra #> 5 data columns #> 50 data points / spectrum #> wavelength: lambda, nm [numeric] 400.0000 406.1224 ... 700 #> data: (20 rows x 5 columns) #> 1. gr: [character] A B ... B #> 2. x: l, cm [numeric] 0.25 0.50 ... 5 #> 3. c: [numeric] 12.64911 12.31601 ... 1.414214 #> 4. t: [numeric] 0.0000000 0.1578947 ... 3 #> 5. spc: I, a.u. [matrix, array50] 1.638282 1.243157 ... 0.1831655plot(hy_spectra)# Generate profiles hy_profile <- generate_hy_profile() hy_profile#> hyperSpec object #> 20 spectra #> 4 data columns #> 1 data points / spectrum #> wavelength: lambda, nm [numeric] 550 #> data: (20 rows x 4 columns) #> 1. z: z, mm [numeric] 0.0000000 0.6931472 ... 2.995732 #> 2. c: Concentration, mol/l [numeric] 0.8414710 0.9092974 ... 0.9129453 #> 3. t: t, s [numeric] 0.00000 21.05263 ... 400 #> 4. spc: I, a.u. [matrix, array1] 0.9497657 0.8041098 ... 0.9965564plotc(hy_profile, model = spc ~ t)plotc(hy_profile, model = spc ~ z)plotc(hy_profile, model = spc ~ c)# Generate hyper-spectral map hy_map <- generate_hy_map() hy_map#> hyperSpec object #> 35 spectra #> 4 data columns #> 5 data points / spectrum #> wavelength: k, 1/cm [numeric] 5000 5750 6500 7250 8000 #> data: (35 rows x 4 columns) #> 1. x: x, px [integer] 1 1 ... 7 #> 2. y: y, px [integer] 1 2 ... 7 #> 3. gr: [factor] A B ... B #> 4. spc: I, a.u. [matrix, array5] 1 2 ... 1plotmap(hy_map)plotmap(hy_map[, , 8000])

